Table of Contents
Navigating Signal Display Controls
There are several menu buttons that signal display pages have that are common for most of them and specific tappable elements on each signal trace.
For details on moving or zooming on the signal trace panes, see Moving and Zooming around in the Signal Display Traces
Real Time RMS has:
- Numeric Display / Signal Display
- Run / Stop
Spectral Analysis has:
- Traces
- Parameters
- Sampling Rate
- Analysis Parameters
- Location ID
- Trigger Setup
- Record Setup
- Control
- Restart
- Record
- Cursor
- Run / Stop
Viewing saved signal data has:
- Traces
- Parameters
- File Property
- Control
- Previous Frame
- Next Frame
- Jump to
- Cursor
Traces
The Traces menu has:
- One Trace
- Two Traces
- Three Traces
- Settings
Tapping on any of the numbered trace button will change how many traces are displayed.
Tapping the Settings button will open another page to select a specific number trace display setting to edit.
Tapping on any one of the number trace display setting will open another page to edit how many signals to display.
Each pane that a signal trace display has, has its own signal list that can be tapped on to open another page to select one to three channels.
Only a specific type of signals can be displayed together with other channels. Thus, users can’t mix and match time stream and APS signals.
Selecting APS signals to be displayed will have additional options to adjust how they are displayed, such as:
- Spectrum type
- View mode
There are options to change the signal color of each displayed signal.
Parameters File Property
Viewing a saved signal parameters shows the file property of the signal data with the following properties:
- Name
- Size
- Type
- Created time
- Number of signals
- Sample Rate
Control when Viewing Signal Data
When viewing a saved signal data, tapping the Control button will display a different set of buttons.
- Previous Frame
- Next Frame
- Jump to
If the saved signal data has multiple frames, these can be used to look at different frames.
Cursor
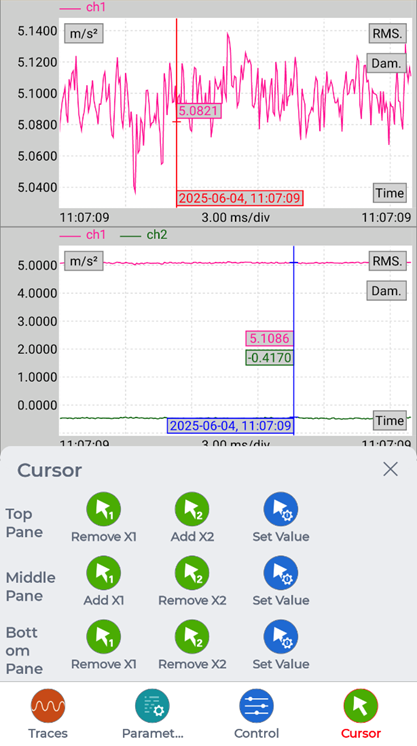
Depending on how many panes are displayed, each has their own cursors that can be added or removed through the Cursor menu button. Up to two cursors can be added.
These cursors can be moved by either:
- Tapping the cursor on the signal pane and dragging it
- Or tapping Cursor > Set Value for the specific pane and modifying a cursor position value
Specific Signal Trace Controls
There are some controls that users can tap on, such as:
- Tapping on the top bar / signal channel list
- Opens a page to change what signals to display for the specific signal pane
- Tapping on RMS
- Adds two cursors and opens the RMS box displaying RMS values on the specific signal pane
- Tapping on Dam.
- Adds two cursors and opens the Dam. box displaying Dam. values on the specific signal pane


