This is an old revision of the document!
DSA FFT Analysis
Follow the guided steps below on how to set-up a FFT Analysis in EDM to use with Spider hardware.
Create Test
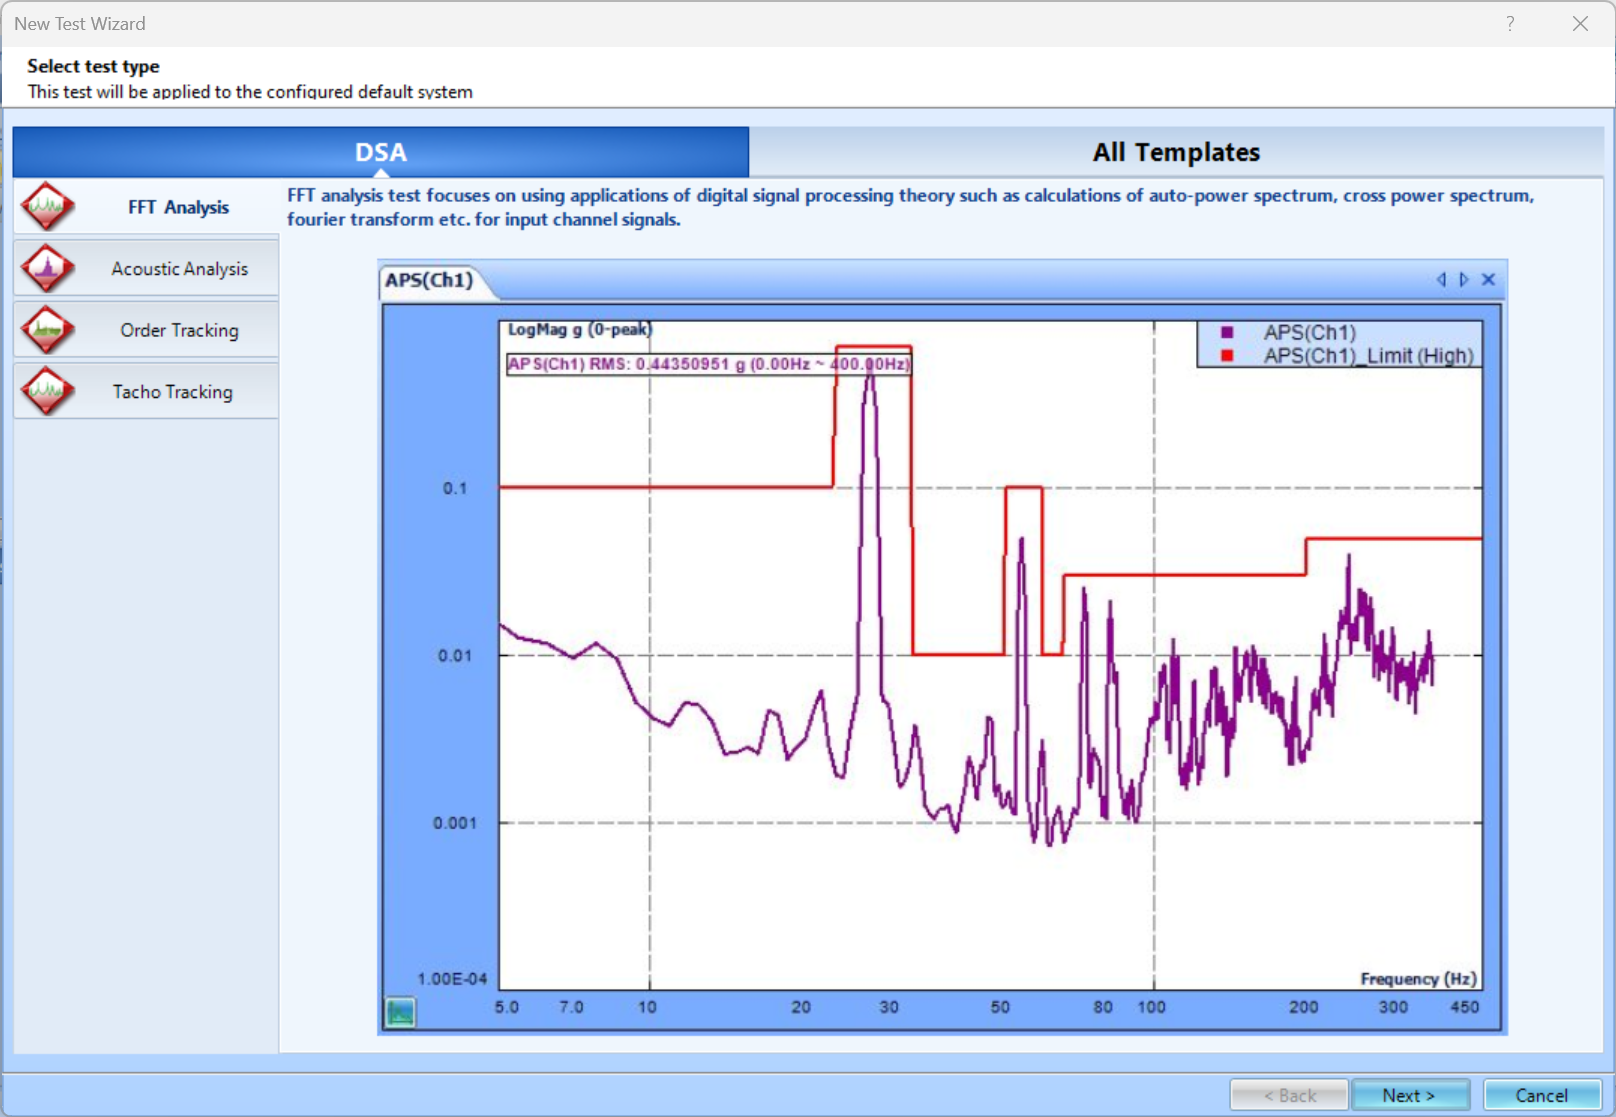
In EDM, select to create a new test. From the New Test Wizard, select the FFT Analysis test type.
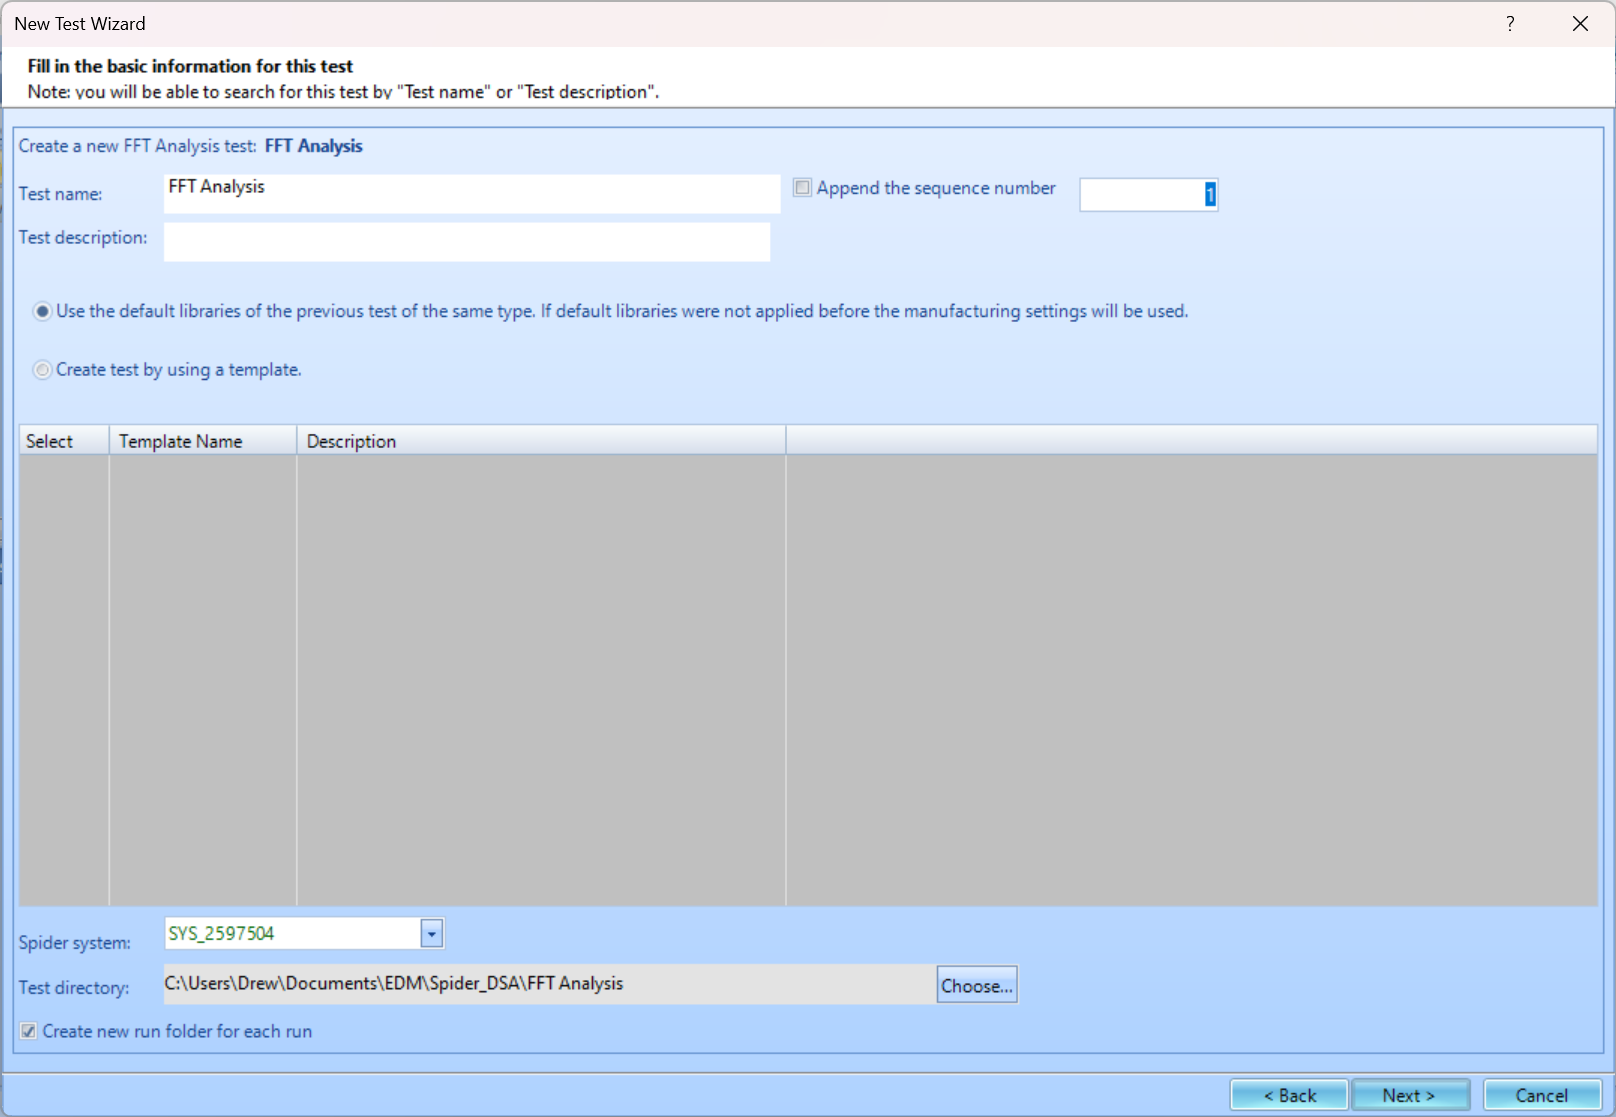
 Next, give the test a name and description.
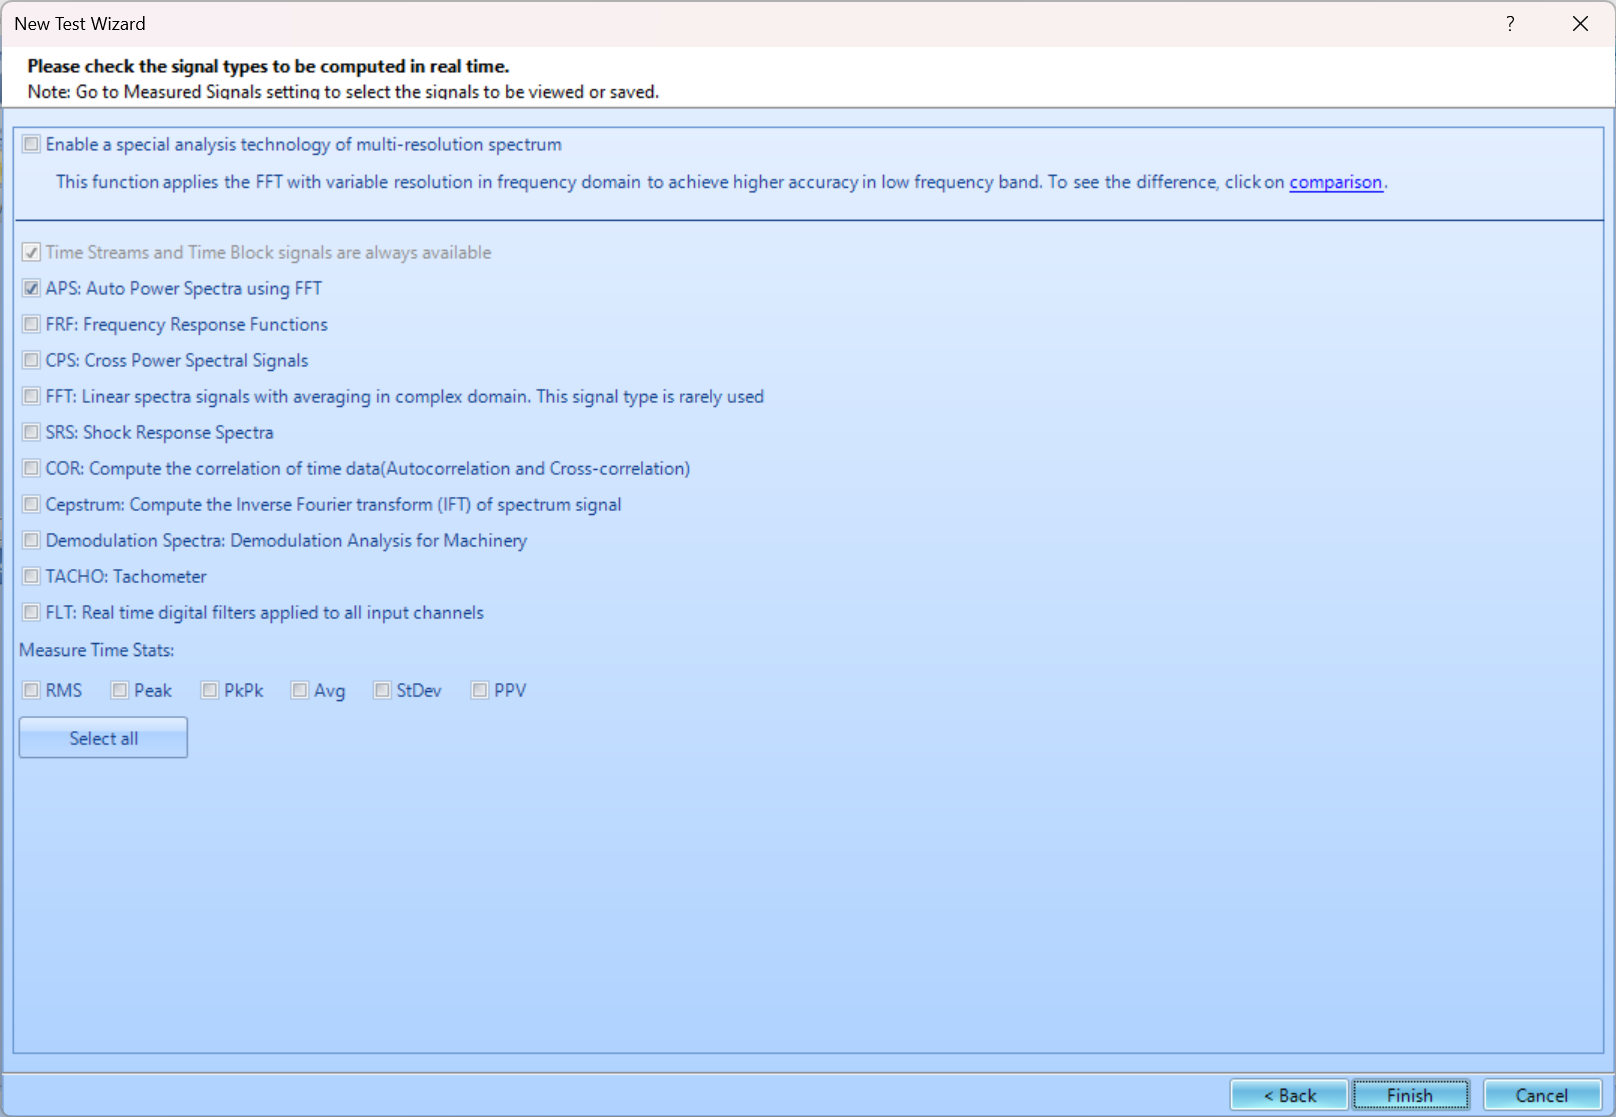
 Finally, select the signal types that are wanted. You can select more than one signal type. Additionally, there Time History Stats can be selected to be calculated as well. You are unable to add more signal types to be computed once the test is created. Press Finish to create the test.

Test Configuration
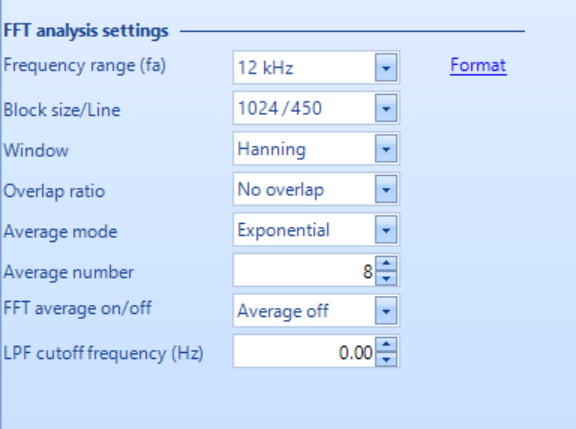
Before testing, the Analysis Parameters must be configured to ensure all the data is properly measured.
Frequency Range (Sampling Rate)- determines the resolution and the span of all time and frequency data blocks. Increasing the sample rate increases time resolution (makes dT smaller) and decreases the time span (Block T) captured. Increasing the sample rate also increases the maximum frequency (Fa) in a spectral block and decreases its resolution (increases dF).
Block size/Line- are the number of samples in each time blocks and the number of (un-aliased) spectral lines in each resulting spectrum. Increasing the block size increases the resolution of the frequency transform and allows lower frequencies to be detected, but it also increases the calculation time and slows down response. The ratio between Lines and Block Size is determined by the characteristics of the A/D converter and its anti-aliasing filter. In general, this ratio is about 0.46, meaning that 1024 samples in the waveform will produce about 0.46 * 1024 = 471 lines in the spectrum.
Window- lets the user choose the window to be applied during FFT operation. Windowing functions can help reduce leakage and increase the precision of the frequency measurement. In general, select Uniform for triggered transients, Hanning for general continuous signals and Flat Top when studying tonal data (such as a rotating machine) and needing extreme accuracy of spectral peaks.
Overlap ratio- sets the proportion of the samples in a time block that are overlapped (redundant with samples in a prior block) when calculating the FFT of (un-triggered) continuous signals. Higher overlap ratios result in faster variance reduction per unit time producing smoother data, but they increase the processing requirements. The Overlap Ratio options are no overlap, 25%, 50%, 75%, 87.5%, 95% and As High As Possible. For most applications employing a symmetrically tapered window function (such as Hanning), an overlap of 50% proves optimal.
Average mode- options include Linear, Exponential, and Peak Hold. Linear averaging treats every block equally. The blocks are simply added together (at each frequency), and the result divided by the Average Number. Exponential averaging is a moving or evolving average that favors the most recently measured block. Old data slowly loses its importance (time exponentially), so that the average is dominated by the current instantaneous spectrum.
Average number- Determines the number of blocks measured for Linear and Peak Hold averages.
LPF cutoff frequency- allows the user to specify the cutoff frequency of the low-pass filter.

At the bottom of the window, the *Test Summary** can be found. This displays important stats about the analysis such as the Block Time, Sampling Rate, and Frequency Resolution (dF).
