DSA Order Tracking
Follow the guided steps below on how to set-up an Order Tracking test in EDM to use with Spider hardware.
Create Test
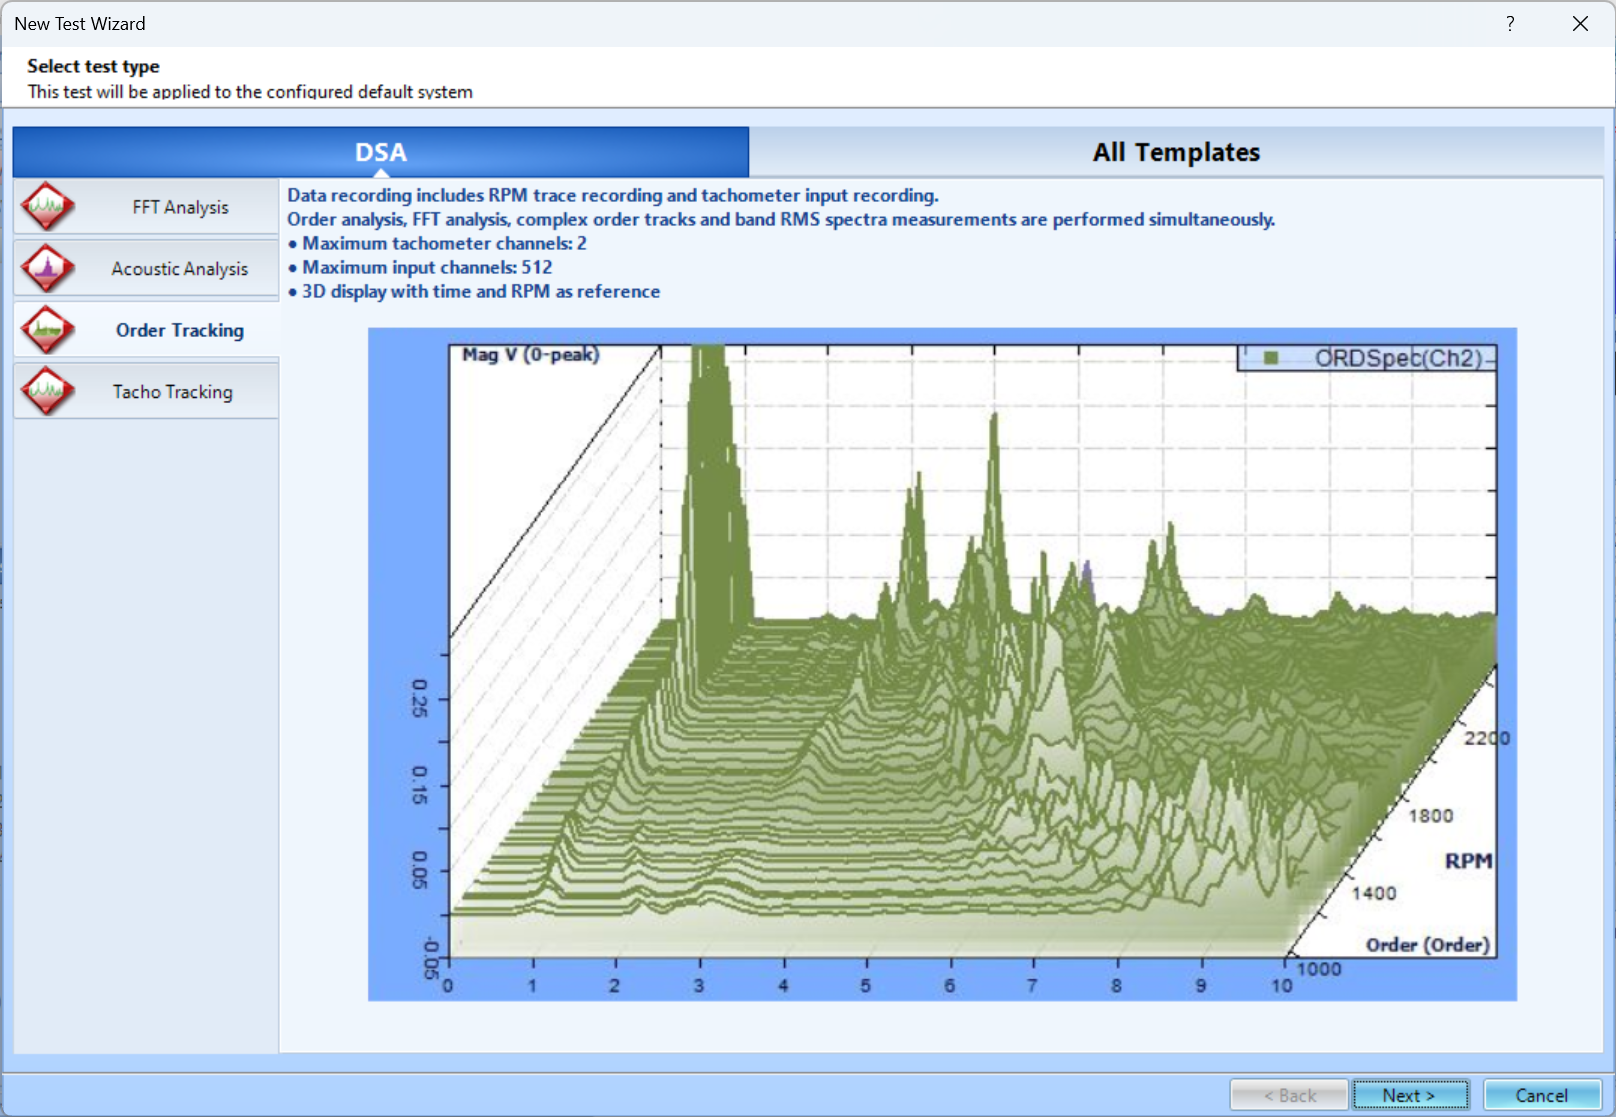
In EDM, select to create a new test. From the New Test Wizard, select the Order Tracking test type.
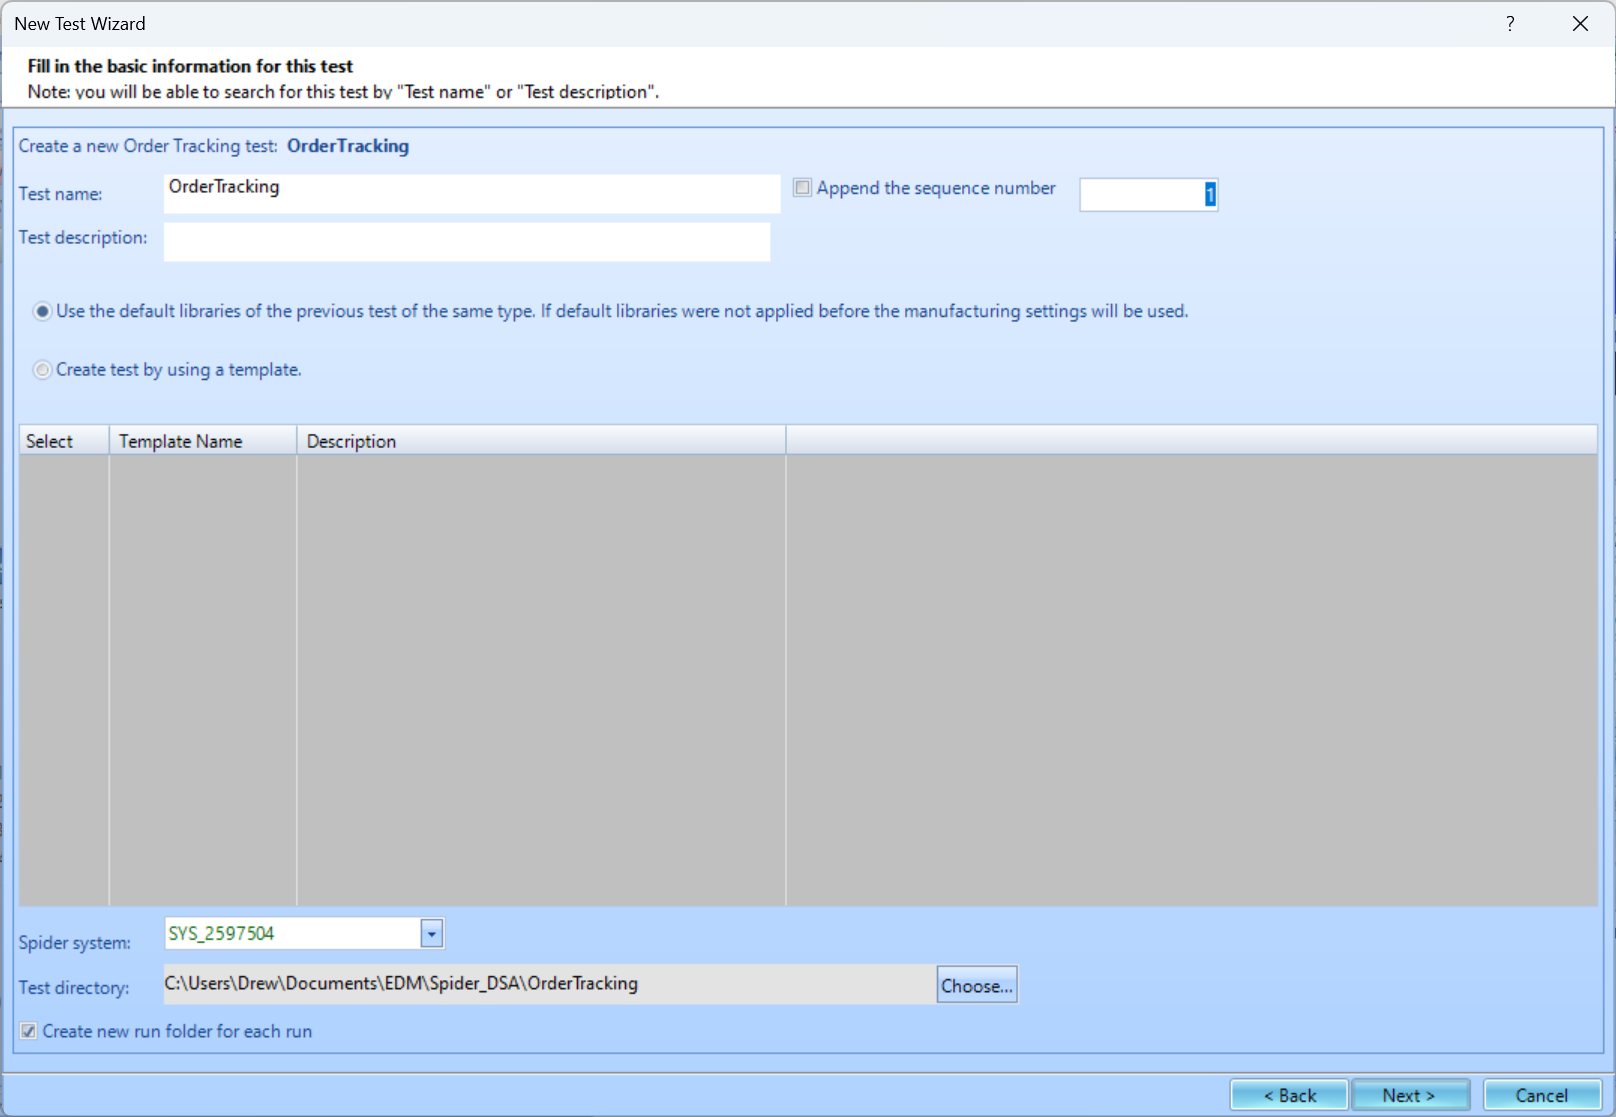
Next, give the test a name and description.
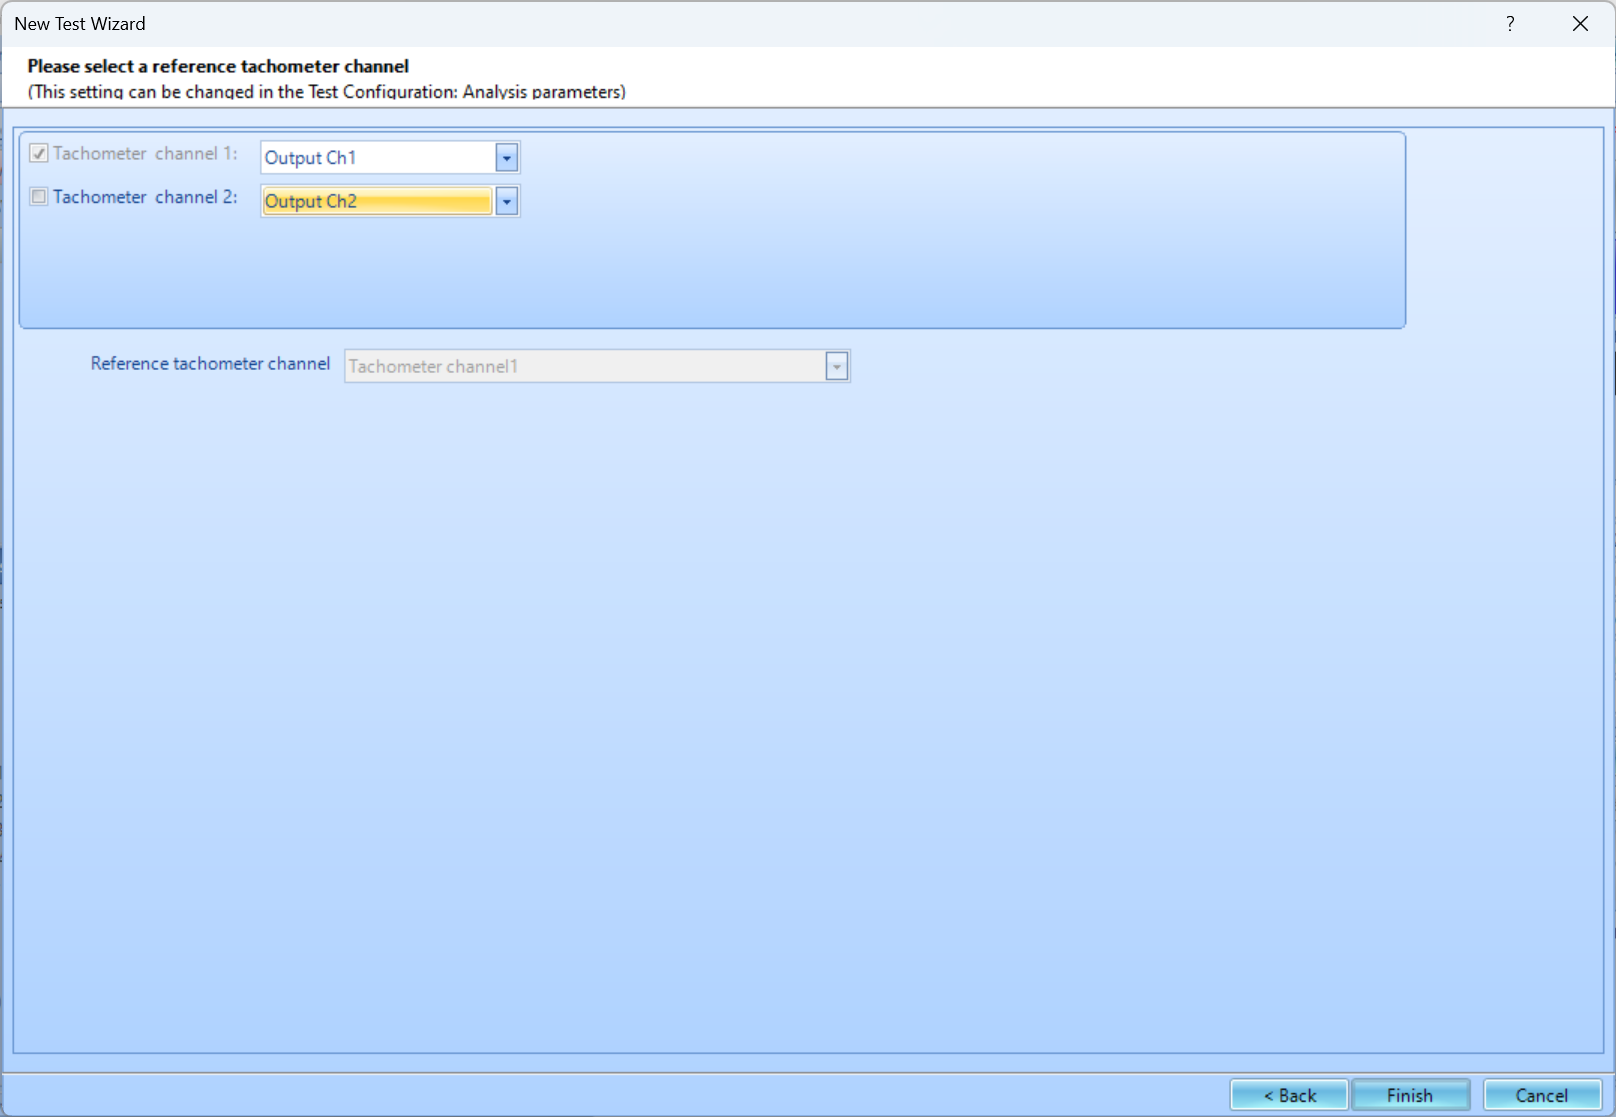
Finally, select the channel that will be used as the tachometer channel. This setting can be changed later after the test is created. Press Finish to create the test.
Test Parameters
There are two parameter groups that are unique to Order Tracking tests, Order Analysis Parameters and Tachometer Parameters.
Order Analysis Parameters
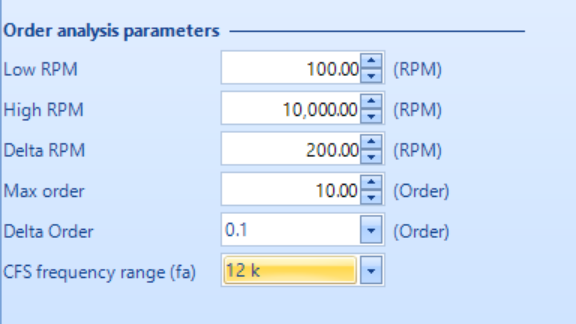
Low/High RPM - The Low and High RPM define the range of RPM for RPM measurements, Calculation of Order tracks and Band RMS Spectra. If the Spider-80X detects that the current RPM is between the Low and High RPM, it will take the measurement and display it. Otherwise, the RPM readings on the control panel will always display 0 and the RPM time streams will always display the value of Low RPM.
Delta RPM - The Delta RPM defines the resolution of the RPM trace or the resolution of the RPM axis for Order tracks and Band RMS Spectra. The smaller the delta RPM, the more frequently the signals will be stored and displayed along the RPM axis and the more storage that will be required. Typically, the Delta RPM is chosen between 25 and 100 RPM.
Max Order - The Max Order defines the highest order number for an Order Spectrum. This is similar to defining the maximum frequency in an FFT analysis. EDM uses this value to determine the analysis frequency range. The user should define the minimum Max Order that the application needs. If the Max Order is too high, the system must sample at a very high frequency to cover the whole frequency range, and the accuracy of lower order estimations may be poor.
Delta Order - The delta Order defines the resolution of an Order Spectrum. The Max Order and Delta Order together define the number of points in a normalized order spectrum. The smaller the value of Delta Order, the better the resolution will be. As a result, more computational resources are required to process the order spectra.
Tachometer Settings
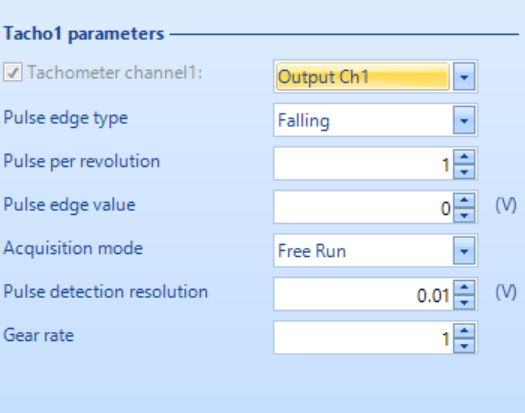
Tachometer Channel - Identifies the channel used as Tacho1 (or 2). The checkbox can be used to enable or disable the tachometer channel and the dropdown menu lists all the channels that can be used as a tachometer channel.
Pulse Edge Type - Specifies triggering upon the rising or falling edge of the tachometer pulse.
Pulse per Revolution - Is assumed from each revolution. The tachometer may generate one or multiple pulses per revolution of the rotating machine. The number of tachometer pulses that need to be counted to complete one machine revolution is set using this parameter.
Pulse Edge Value - Is the threshold voltage level that the input tachometer pulse needs to exceed to be detected as a pulse.
Acquisition Mode - Controls the processing of the tachometer signal
- Free Run acquires data regardless as long as the RPM is between the low and high RPM limits.
- Run Up acquires data when the RPM starts below the low RPM limit and then increases. Acquisition stops when RPM exceeds high RPM limit.
- Run Down acquires data when the RPM starts above the high RPM limit and then decreases. Acquisition stops when RPM exceeds low RPM limit.
- Run Up & Down acquires data when the RPM starts below the low RPM limit and then increases. Acquisition continues when RPM goes above high RPM limit and then decreased to low RPM limit.
- Run Down & Up acquires data when the RPM starts above the high RPM limit and then decreases. Acquisition continues when RPM decreases below low RPM limit and then increases past the high RPM limit.
Pulse Detection Resolution- is a hysteresis value applied to the trigger transition voltage. If a rising edge is specified, a low state must be at least the pulse detection resolution below the pulse edge value. If a falling edge trigger is specified, this constraint applies to the pre-trigger high state.
Gear Rate - is the ratio between two gears.
Creating and Viewing 3D Signals
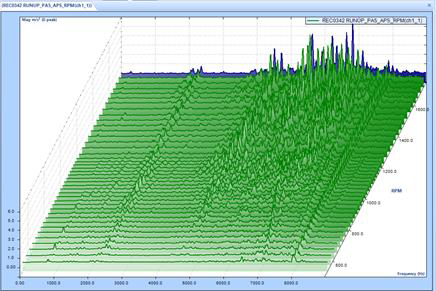
3D signals are of particular importance in Order tracking and enable convenient analysis by plotting the consecutive blocks of data in the 3rd dimension to analyze the changes in the block signal. Typically, the Z-axis or the Reference axis can be Time or RPM.
3D Waterfall Trace- is used to display order spectra and order tracks vs. RPM or time in three dimensions.
Color Spectrogram- is used to display order spectra and order tracks vs. RPM or time in 2 dimensions using color to represent the magnitude of the signal.
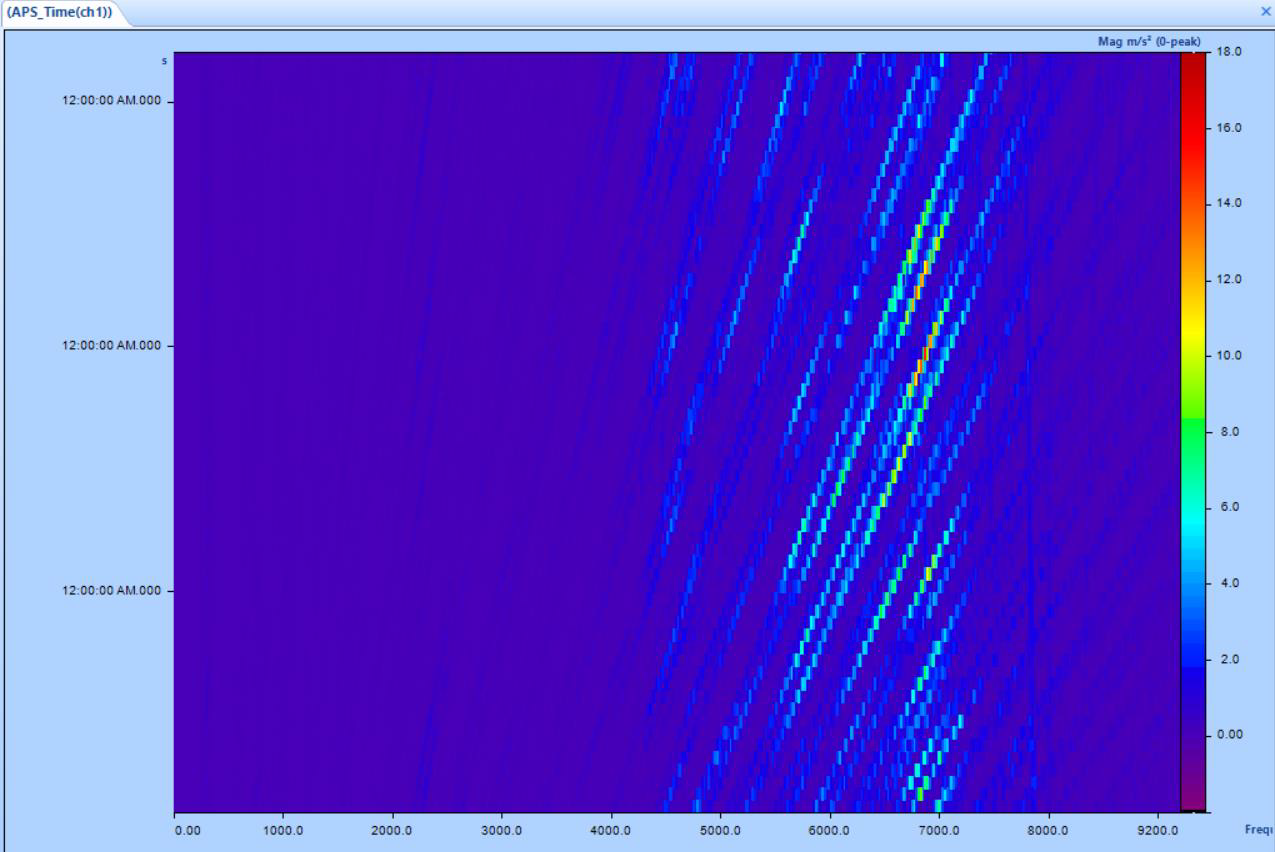
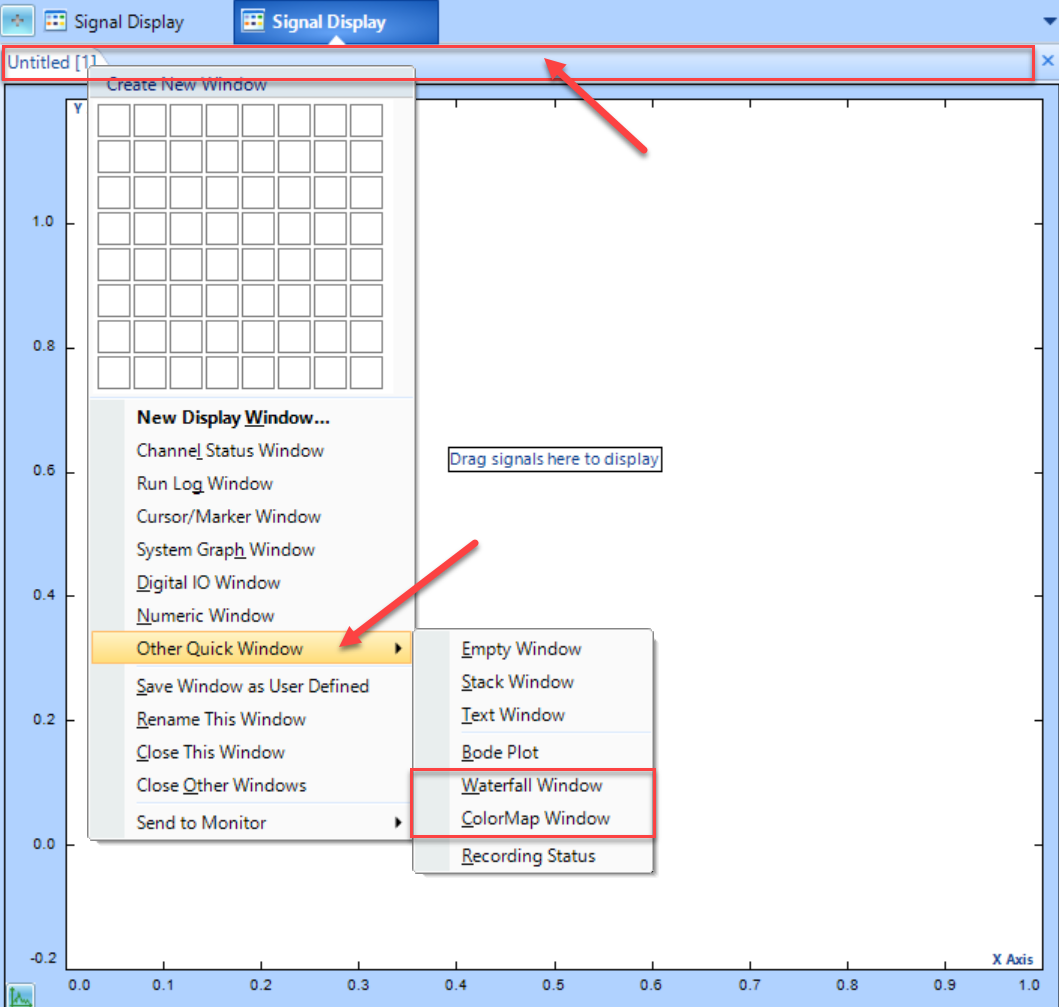
To create this plots, right click on the top of the window view. The Create New Window will pop up. Select Other Quick Window and then select Waterfall Window or ColorMap Window.
